 Special thanks to my co-worker Tiphaine for the illustration \o/
This blog post was initially posted on our company blog, I replicated it here solely for archiving purposes.
Performance is a core feature of Algolia. Our search engine delivers millisecond results across millions of records. It was originally designed for mobile devices where the resources are very limited, but was after transformed into an online API that now runs as an NGINX module. Our front-end libraries are written in a way that allows us to express that same speed on the client and ensure a high quality experience across devices.
Algolia’s engine and integrations are a great benchmark and an inspiration for performance, so we wanted to mirror that excellence in performance of our website.
Reducing the payload
No bit is faster than one that is not sent; send fewer bits.
— Ilya Grigorik, web performance engineer at Google; co-chair of W3C Webperf WG.
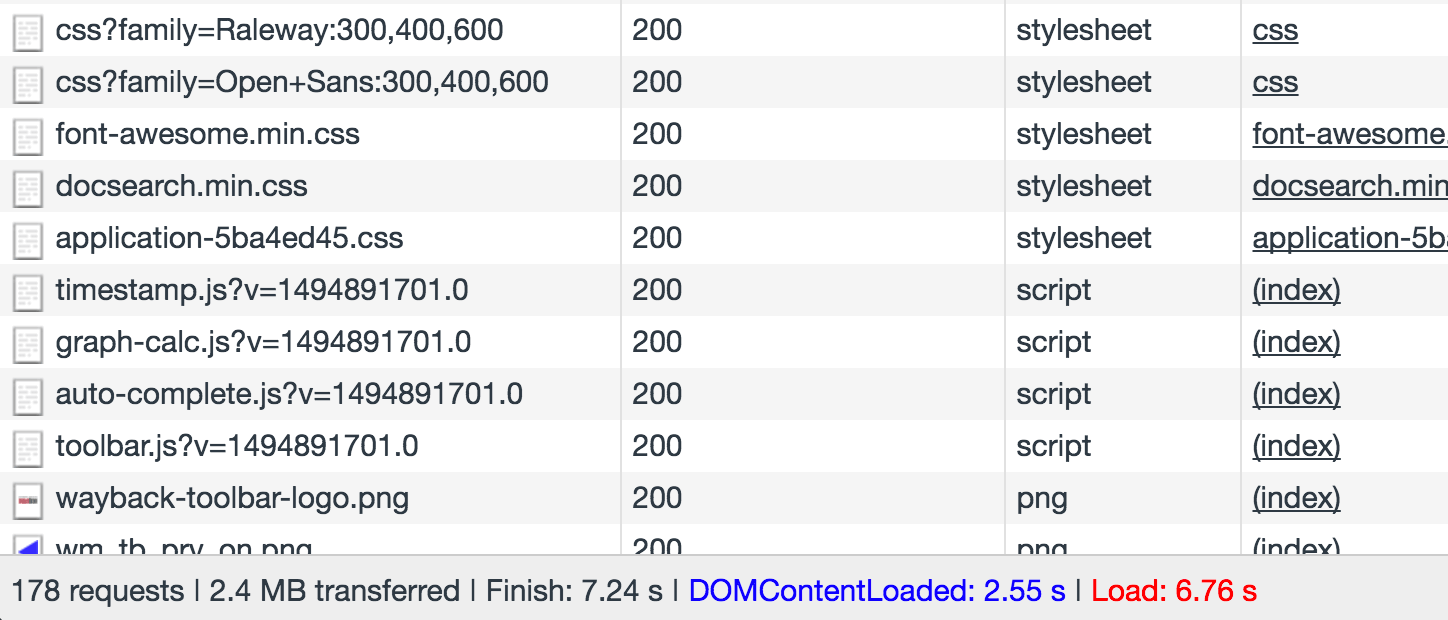
As Ilya says, the fastest way to have a fast website is to send as little data as possible. Our website was relying on plenty of external dependencies, which increased the total size that needed to be transferred and delayed the load time. A total of 180 requests and 2.4MB had to be transferred by our website visitors.
Drop JavaScript dependencies
Removing dependencies such as jQuery, Underscore and a few others reduced our total JS size to about 20% of it’s initial size. This didn’t have a big impact on the way our front-end code was written, but it forced us to write it using the native browser API such as the querySelector API vs. using jQuery.
To ease the process, I integrated transpiling of our code so that we could write ES6 code and transpile it using Babel. This made writing the code more productive and faster.
Runtime performance
To avoid the jank behaviour once the website is loaded and ready for user interaction, it’s very useful to profile JavaScript code to find bottlenecks.
Chrome Developer Tools has a very useful rendering tab inside its console drawer, which show areas on your website that are regularly being updated and might be the cause of jank.
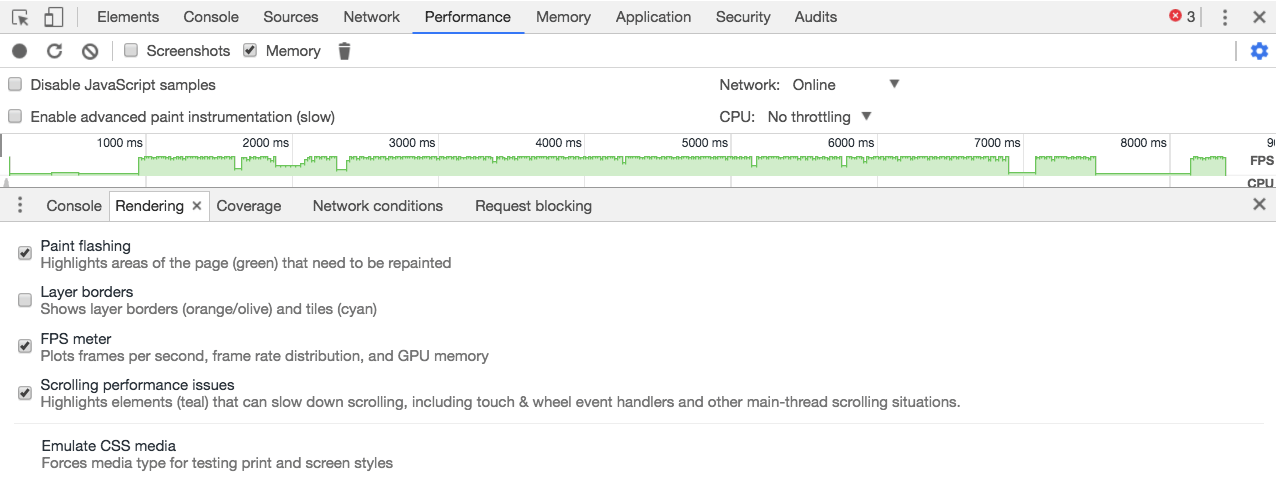
This mostly meant rewriting our scroll event listeners using the new IntersectionObserver API, making sure our DOM operations are not too frequent and our animations only cause composite browser operations (see csstriggers for a list of operations needed to update a property).
This reduces the heavy lifting needed by the browser to paint and repaint the screen, which in return provides a silky smooth experience for your users.
Reduce CSS size
Because the front-end team didn’t have a real convention of writing CSS, the size and specificity of it was growing fast as we added new pages. To tackle that, we wrote a small set of our own helper classes and adopted a way of writing the HTML using those classes. Doing it reduced the CSS file size to ~60% of it’s initial size, and paved a good way of adding new pages to the site while not increasing the CSS size further.
The pesky time-consuming part was done; now it was time to make sure the users actually see the page as fast as possible.
Prioritizing first paint
To prioritize first paint I needed to determine which assets are critical for our website to render. That meant asynchronously loading all of the render blocking assets except a few very small images like our logo and our main application.css file which weighs about ~50KB.
The goal of this is to show the website on the screen faster by loading the rest of the assets in the background.
Below is what the loading looked like before the critical assets were optimized.
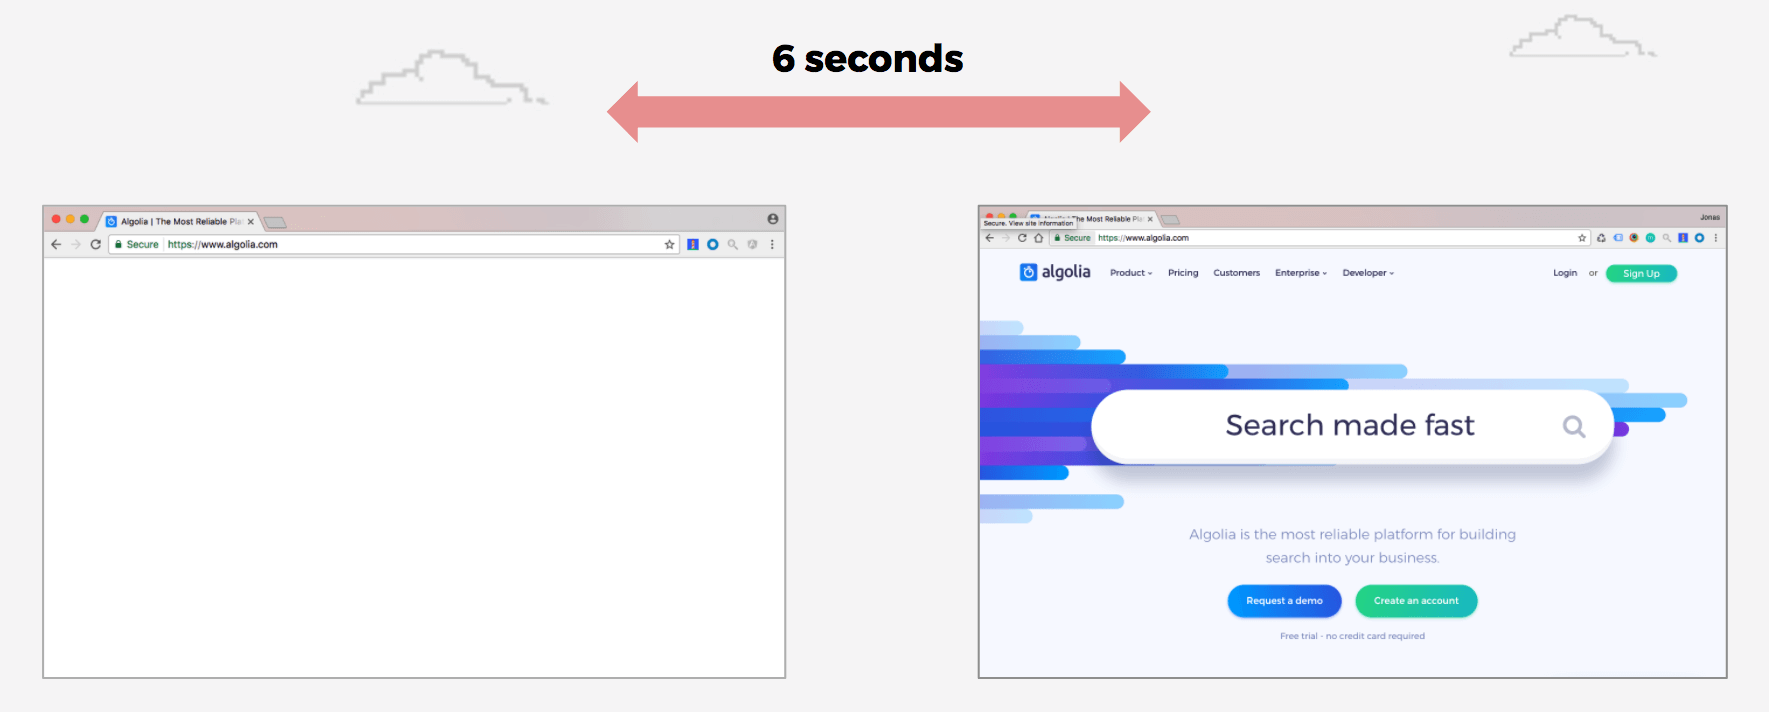
The optimized experience:
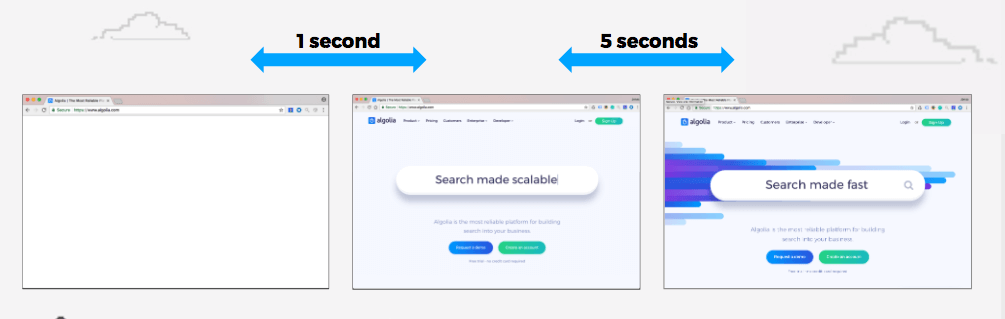
This optimization results in a faster perceived performance experience whereas the total loading time stays about the same.
Along with having as few critical assets as possible, it is also a good optimization to have those assets hosted on your domain. Otherwise each of the requests made to different domains will have to go through the DNS lookup, connection and SSL negotiation phase, which will accumulate on the round trip time needed to perform the request.
For instance, if you are using Google fonts from their CDN and your server supports HTTP/2 protocol, it’s probably better to host the fonts yourself on the same domain as the initial request. This will bring significant improvements for the visitors coming from mobile networks, where the signal quality is poor and request round trip times are higher.
In our case, self hosting a font instead of loading it from google fonts CDN improved load time by about 1s on 3G connection.
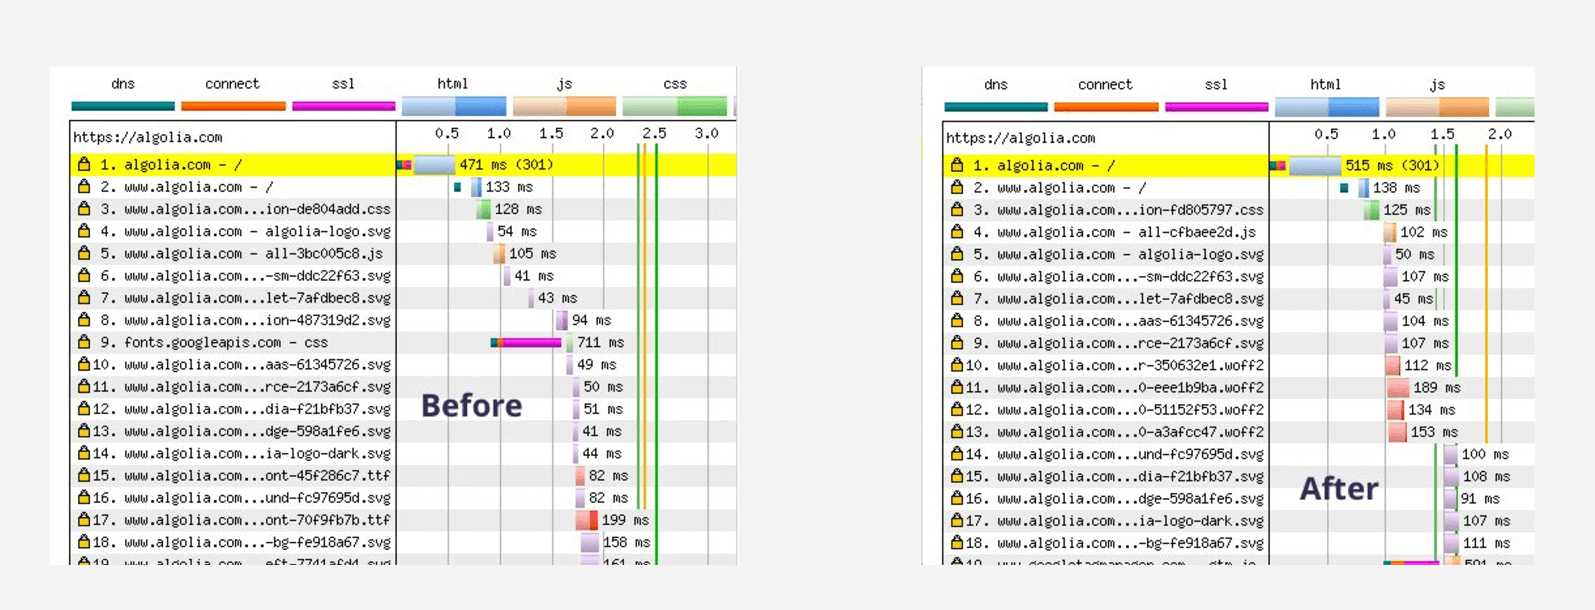
If you look closely, you can also see that the fonts.googleapis request actually requests a CSS file which contains the @font-face rules that then create the actual request to load the font files. This means that, by including @font-face rules in our application.css file, we also save an additional request — a double win. If you are looking to do a deep dive into font loading strategies, Zach Leat from FilamentGroup wrote a very helpful overview of the improvements you can do today.
Adding WebP support
WebP is a new type of image format which enables better lossless and lossy compressions. The support for it is growing, so I decided to test it.

I ran a few compression tests and saw that it was able to compress the file size to about an average of 75% of the original, which saved us hundreds of Kilobytes.
When looking to integrate WebP support into our build process, I found a simple way to do so using Cloudflare and their Polish option. I saw that they allow automatic WebP image compression through their Polish feature, which took complexity of integrating WebP out of scope; enabling it was as simple as clicking a button.
After the Polish option and WebP compression are enabled, Cloudflare does the heavy lifting. It checks if the image request contains accept header with values image/webp or /, as seen below. If the header matches, it converts the original image into WebP format and adds a content-disposition header with the value of inline; filename=”path/to/image.webp” instructing the browser that the file will be displayed inline on the page and giving it the file path to the resource.

Accept header with webp support — img/webp and /
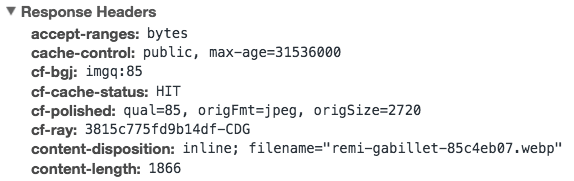
Response header with content-disposition
In our case, Cloudflare’s solution worked well which meant I didn’t have to update server configuration and integrate WebP conversion at build time. However, if that is not the case for you and you want more flexibility, Ilya Grigorik wrote a sample config for detecting WebP support, and there are multiple libraries that you can use to convert images to WebP format.
Using HTTP/2 server push
One of the great things with HTTP/2 is that it has features like multiplexing connections and server push, which are substantial performance improvements to HTTP/1.1.
Multiplexing connections allow browsers to send multiple requests through a single connection, which significantly reduces the number of required connections between the client and the server.
Server push is a feature that allows the server to start sending assets that the client has not yet requested, but knows that the client will need, and so it eliminates the extra time the client would otherwise take to parse the response and request the assets.
You can implement server push either by adding custom HTTP headers, or by adding the link rel=”preload” and as=”
To additionally improve the time to first paint, I decided to avoid polyfilling link rel=”preload” and set Link headers for our remaining render-blocking assets. This resulted in faster load time of assets and improved time to first paint by about ~400ms (depending on connection quality).
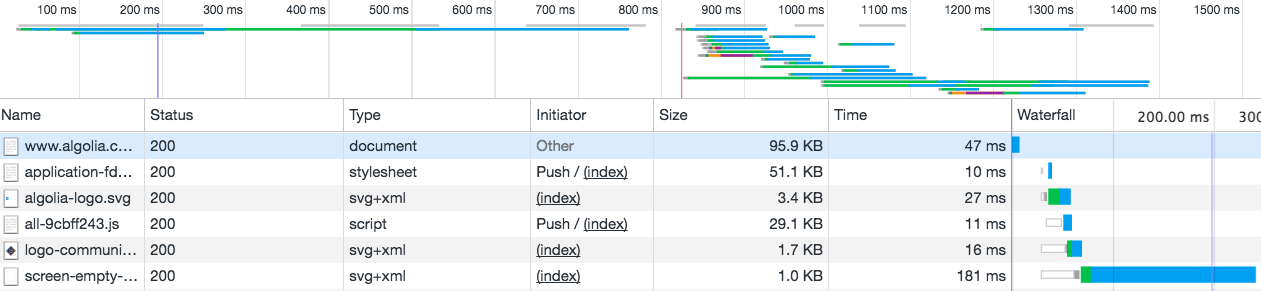
To validate the assets were server-pushed, check the developer tools network tab, where you can see that the request was not initiated by the browser after parsing the document, but was rather pushed by the request for index.html.
If you are looking for a good hosting solution with advanced features like HTTP/2 server push, have a look at Netlify — they just added server push support and their hosting is very solid.
The hidden bottleneck
As I was optimizing our website, I looked for the obvious quick wins, but there is one thing I didn’t really look at — the HTML document size.
The compressed size of our index.html was 60KB.
The reason for that were inline SVG assets. Inlining SVG is often advised in the web community because of its flexibility. There are plenty of articles that advocate for it, but they are often flawed in that they recommend it as a universal solution, whereas it should depend on the use case. There are often better ways to load inline SVG assets than inlining them straight into the document.
Inlining SVG files bear two major consequences:
- document size increases
- assets are not cached
If you are accessing a website where the index.html file size alone is ~60KB, it will take time to fetch the document itself and after it’s finished, you still need the rest of the critical request to render the page.
By combining SVGs into a store, asynchronously loading and injecting them into the document, I was able to reduce the size of our HTML file from 60KB to ~15KB + as an added benefit, we were now caching those — a double win again.
Measuring results and changes
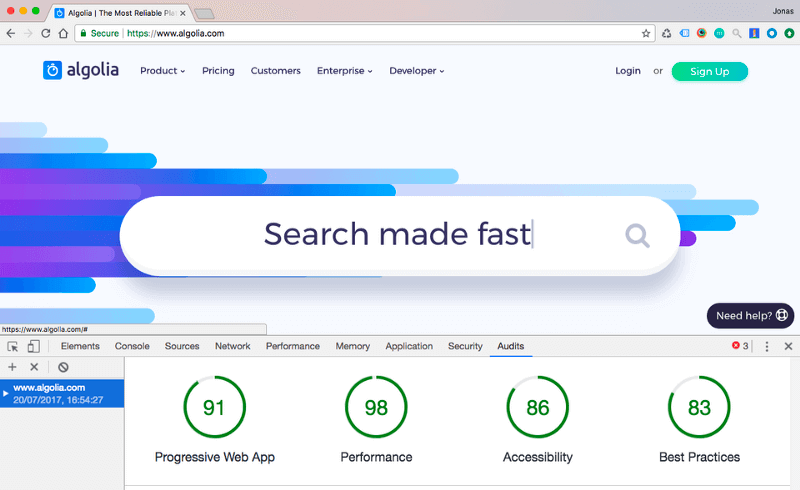
Throughout the development I used two main tools to measure the performance impact of our work — Chrome Lighthouse and webpagetest. The first tool — Lighthouse— can either be accessed through Chrome developer tools under the audit tab, as a CLI tool or as a Chrome extension. It provides valuable information and front-end metrics, whereas webpagetest can be used to go deeper into the network audit itself.
The results
We have seen a big improvement in loading performance: our website now loads much faster even on poor connections, ensuring that our visitors get a fast experience both when browsing our content and using our engine.
The total size of the website is now ~700KB compared to the original 2.4MB, with about ~300KB of external dependencies that we decided to keep for now. The amount of total requests is now in the 70s range compared to ~180.
In addition, our team was able to improve runtime performance and add more logic and animations to the website without having a negative impact on page performance.
To sum up
These improvements have helped stay on track of providing a unified and fast experience to all of our users and visitors (our documentation and our community page have also been updated with performance in mind).
I have had the chance to do a presentation of the topic to my Algolia co-workers, raising performance awareness within the company. A few weeks after, I did the same talk at a PWA Paris Meetup that we hosted in our Paris office. For those interested, the video is available on YouTube.
Last but not the least, I’d love to hear your comments and suggestions on the topic: @JonasBadalic. Thanks for reading 🙂